Apache Kafka 实践:集群监控方案
2017-08-19
1.概要
判断当前 Kafka 集群性能如何?性能:并发效率、消息延迟、消息积压情况。这所有的基础都是:Kafka 集群的监控。
2.Kafka 监控
几个朴素的问题:
- 监控的具体目标,是什么?
- 监控哪些指标?
- Kafka 集群,涉及哪些关键组件?
2.1.核心原理简介
todo:
- Producer、Broker、Consumer 等的简介。
2.2.监控指标
Kafka 官方,给出的建议:
We recommend monitoring GC time and other stats and various server stats such as CPU utilization, I/O service time, etc. On the client side, we recommend monitoring the message/byte rate (global and per topic), request rate/size/time, and on the consumer side, max lag in messages among all partitions and min fetch request rate. For a consumer to keep up, max lag needs to be less than a threshold and min fetch rate needs to be larger than 0.
整体 3 方面:
- OS 级别: CPU、IO
- JVM 级别:JVM GC
- Kafka 级别:
- Client:message/byte rate (global and per topic), request rate/size/time
- Consumer: max lag in messages among all partitions and min fetch request rate
2.3.方案选型
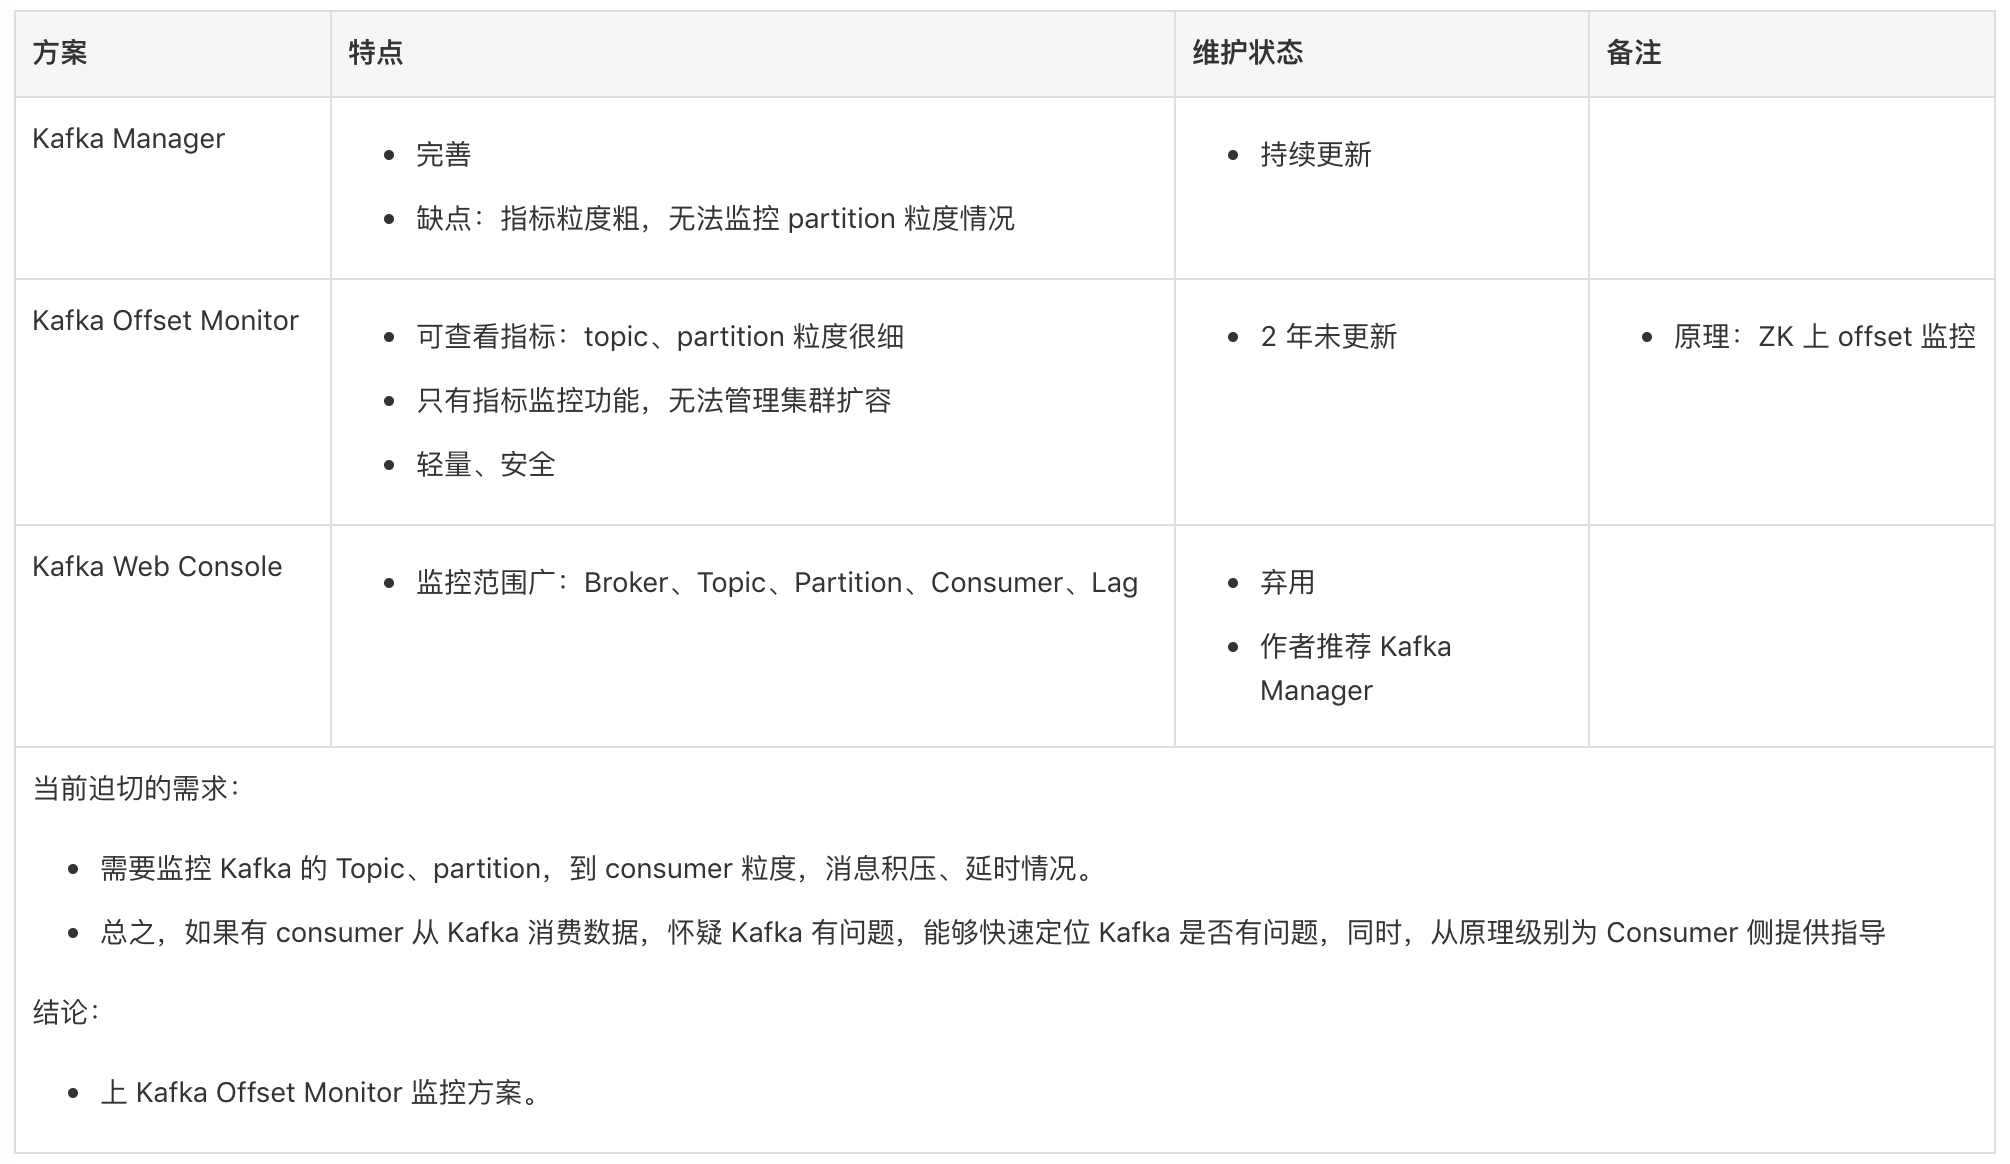
现在几种方案:
- 发行包:HDP 发行包中 Ambari 监控聚合 Kafka
- Kafka Manager:https://github.com/yahoo/kafka-manager
- KafkaOffsetMonitor:https://github.com/quantifind/KafkaOffsetMonitor
- KafkaWebConsole:https://github.com/claudemamo/kafka-web-console
几种方式,对比分析:
2.4.监控部署方案
初步选定 hdp-kafka-server 作为监控部署服务器,并且新挂载一块磁盘用来。
部署步骤: https://github.com/quantifind/KafkaOffsetMonitor
Mobike 内部,当前的部署位置:
- 机器:hdp-kafka-server, 10.1.102.44
- 目录:
/root/kafka-monitor(备注:软链接到/data/kafka-monitor) - 启动脚本:
kafka-monitor.sh - 启动命令:
nohup ./kafka-monitor.sh & - 补充信息:
- 启动之前,需要确认上次启动的 KafkaOffsetMonitor 关联进程已经关闭,
- 关闭办法,查看 kafka-monitor.sh usage 说明
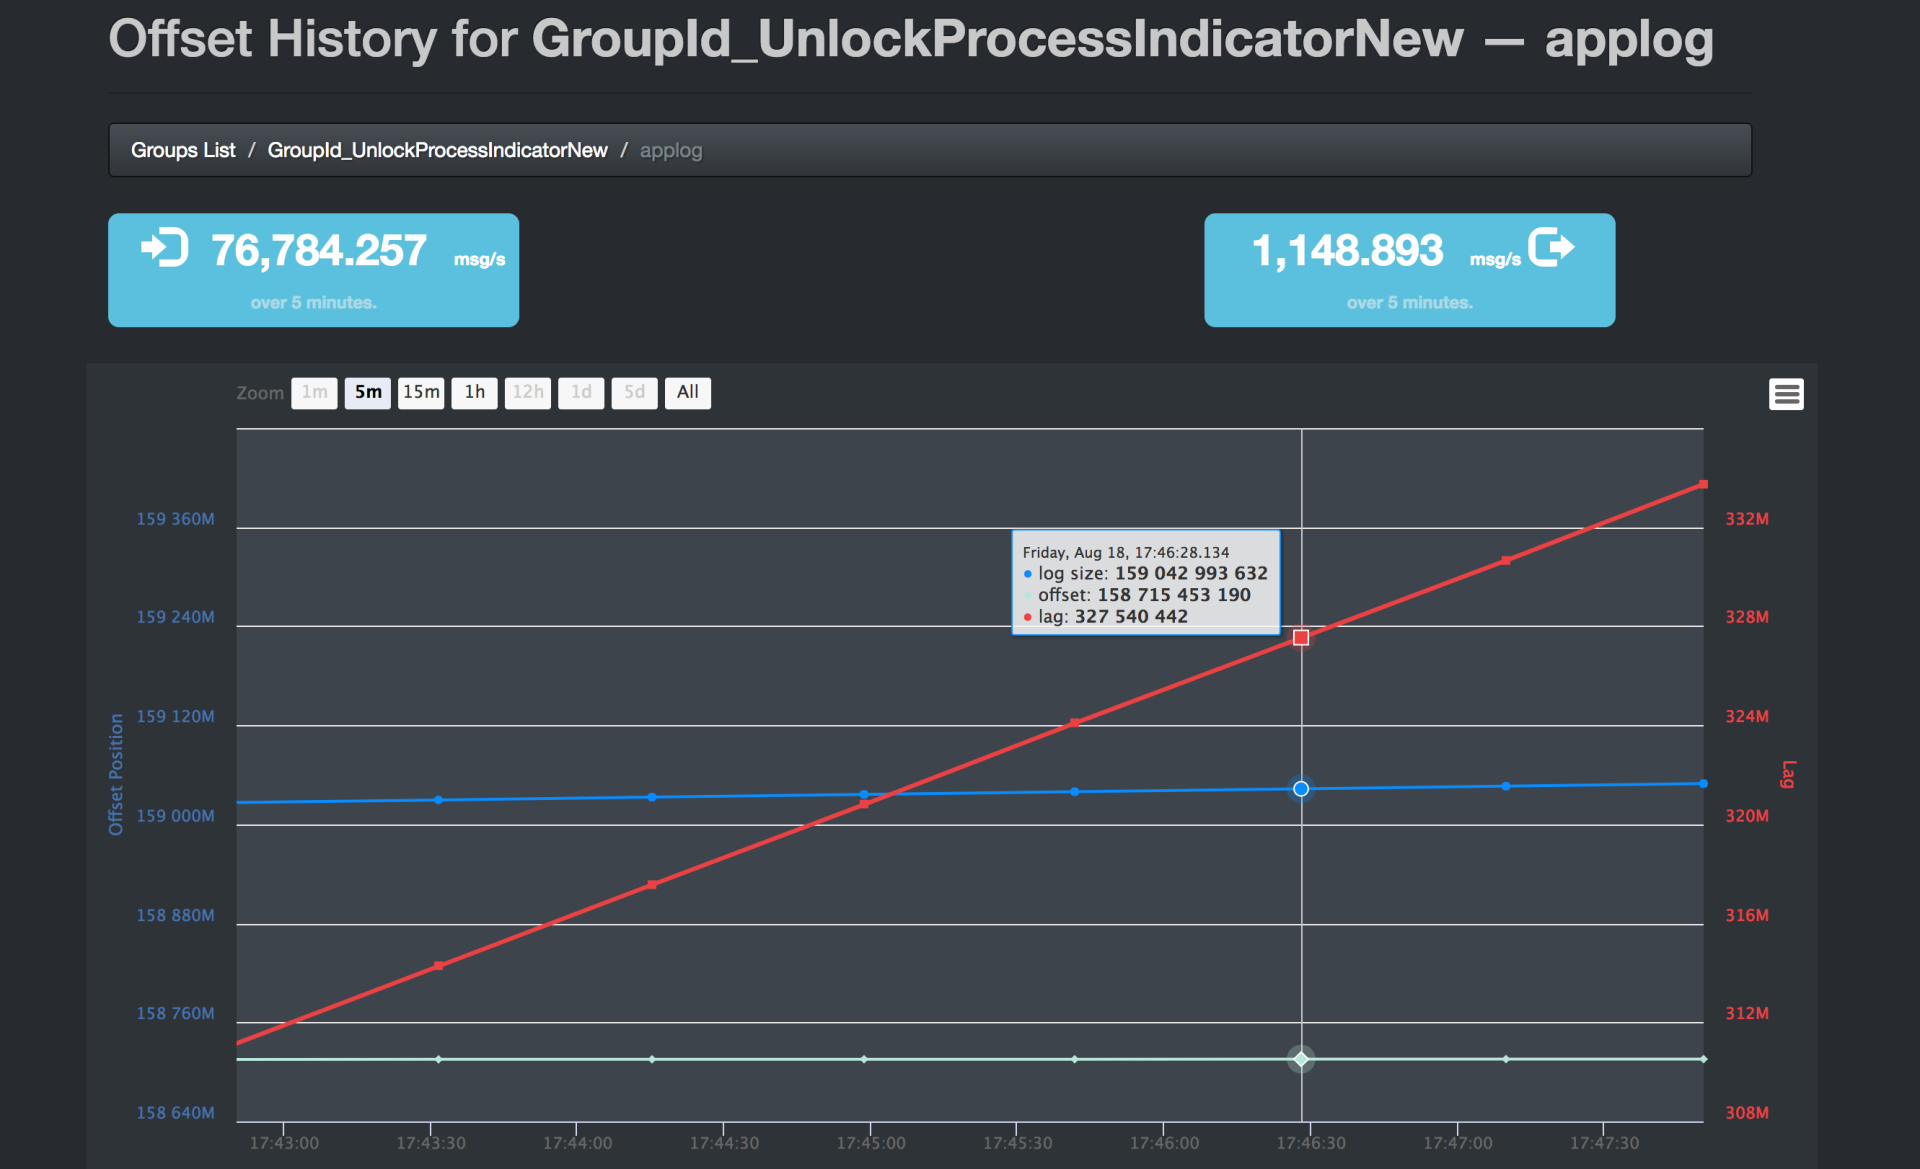
效果样图:(consumer 消费能力不足,导致 Kafka 中消息堆积)
3.参考资料
原文地址:https://ningg.top/apache-kafka-practice-kafka-monitor-plan/